Introduction
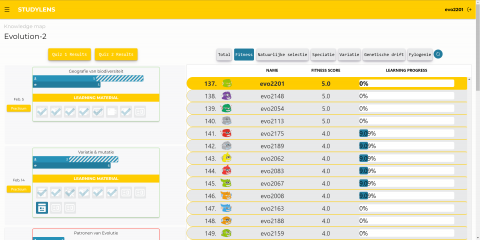
Online courses using dashboards with visualizations that allow social comparison are very popular nowadays. These visualizations can range from progress indicators to gamification elements, like a leaderboard or badges. The impact of such comparative visualizations has been researched a lot and produced conflicting results. The influence of a dashboard containing a combination of progress indicators and leaderboards has not been thoroughly explored yet. This research investigated this exact thing and was looking for evidence regarding differences in the behavior of students on a dashboard containing both progress indicators and leaderboards.
Methodology

The experiment was organized as an observation study during an undergraduate course. Accompanying the course was a dashboard created using a modified interface of StudyLens. StudyLens is a learning support system that visualizes the students’ progress and gives access to learning materials. We tracked the students’ interactions with the dashboard using the application logs. Participants were asked to fill in a pre-questionnaire containing questions from the Achievement Goal Questionnaire and Iowa-Netherlands Comparison Orientation Measure. The questionnaire gave us insight into the students’ social comparison habits and achievement goal orientation.
Findings
To find similar students, we clustered the students together based on their pre-questionnaire similarities. We then analyzed the clusters to see if they behaved differently on the dashboard. A difference in behavior was noticed when different clusters of students interacted with the leaderboard. Other individual differences did not yield any significant difference in behavior between the students, like the difference in pre-knowledge or the amount of meaningful interactions with the system. From these findings, we can conclude that the design of future learning tools should remember that students will behave differently based on their social comparison habits and achievement goal orientations. Other than that, more research is needed to conclude whether more individual differences influence students’ behavior on a dashboard containing social comparison elements.
